|
|
 |
|
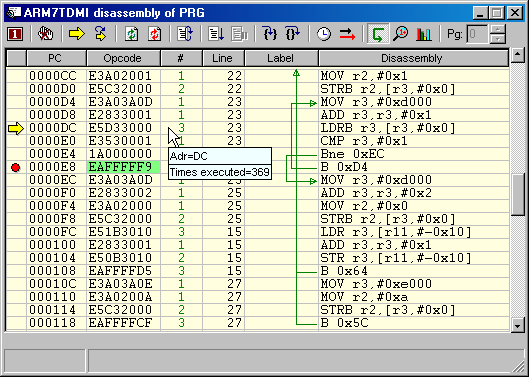
The
disassembly
window is used to view the source code on disassembly
level. The address, current location of the program
counter, opcode, timing figures, line information,
labels & jumps, and mnemonics are shown. You can set or
remove breakpoints in the disassembly window.

|
|
|
|
|
 |
 Set unlimited amount of execution breakpoints without
decreasing simulation speed
 Simulation control: Run, single step, break, step into,
step over, step 1 clock, step only
this core one clock, run till here
 Context sensitive popup window, including timing info on
individual stall cause basis or
provides corresponding C source file and file location dependent on
mouse location
 Show program flow
 Show cumulative or individual timing information
 Able to generate an interrupt when this line of code is
executed (corner case testing)
 Shows profile information on individual code line basis
 Jump directly to corresponding C source
 Able to set program counter to different location (back)
and redo execution
 |
|
|
|

