|
The
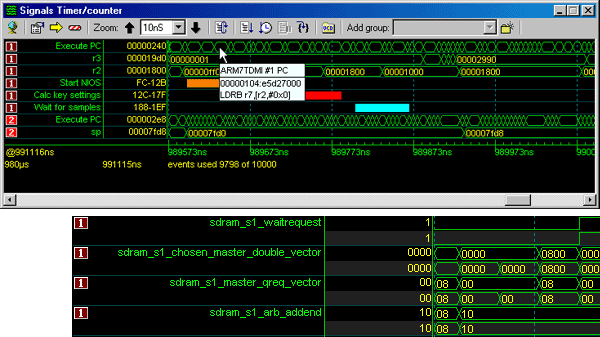
signals window shows time related waveforms of signals.
Signals from different modules (Instruction Set
Simulators and HDL designs) can be viewed in the same
window to observe time relationships. In front of each
signal the module identifier is placed. In the figure
below you can observe the program counter of an ARM
(core 1) and of a NIOS II CPU (core 2). Hovering with
the mouse above a
signal provides additional information: for a program
counter also the data pointed by the program counter and
the disassembly of that data is presented.
Signals from
an ISS can be directly related to HDL signals during
execution of code. Many features are included to
highlight information of particular interest.
A Value
Change Dump (VCD) file can be loaded to verify a design
against a given set of waveforms, which may be derived
from a model or from another digital simulator. Signals
which are part of the Signals window are automatically
connected to their counterpart in the VCD file. For such
signals two traces are drawn, the VCD trace and the
trace derived from the current simulation.
Program flow:
XXYY

|

